
David M Roberts
Consultant in 3D Seismic Interpretation, Visualisation, Visual Integration, and Exploration and Development Geoscience
Get much more value from your 3D seismic surveys using PaleoScan – the next generation 3D interpretation software application. It is now possible to completely and robustly interpret any size of 3D seismic survey in just a few days. Send me a 3D SEGY file and I will be happy to show you!
This website was updated on 11th July 2026 and now has three images from my recent presentation at the EAGE in Aberdeen - 'PaleoScan - Megamerge, Bathymetry, LIDAR and Field Development work' aka 'What happens when you give PaleoScan to a Pensioner'. I repeated the presentation as a 'Finding Petroleum' webinar on Friday 3rd July 2026. The 'Finding Petroleum' webinar presentation is now available for you to watch on YouTube https://youtu.be/MwgHbk5NSPQ if you wish.

Fig 1: Above is a summary of the workflow I often use for very rapid 3D seismic interpretation using PaleoScan. The Maui 3D survey was acquired offshore New Zealand in 1991.

Fig 2: This is a horizon slice from the Maui 3D created using PaleoScan. The horizon slice is
coloured by an RGB blend of spectral decomposition data, which highlights the
depositional system at this level in dramatic style.

Fig 3. This animation shows several sequential horizon slices from the Maui 3D coloured by an RGB blend of spectral decomposition data. This illustrates the depositional system in more detail than the single horizon slice shown above. These horizon slices were created using PaleoScan.

Fig 4. I recently discovered it is possible to load at least three of the gigantic North Sea Megamerge 3D surveys totalling 200,000 sq.km. into PaleoScan - and conduct a respectable first pass regional interpretation of each survey - all within two weeks. The relatively new PaleoScan compressed VDS 3D seismic data format (and trace decimation from 12.5m to 25m) allowed the original size of the 875GB SNS SEGY file to be reduced to a still huge, but manageable 164GB. I presented the results of this work at the first Eliis Pulse User Group Meeting (in a London cinema) on 14th Oct 2025 and again at the EAGE in Aberdeen on 10th June 2026.

Fig 5. This is a 3D view of SE Dorset, England showing high resolution topography onshore derived from 1 metre lateral resolution LIDAR data (from DEFRA), and 2 metre lateral resolution bathymetry data offshore (from the UKHO) - all loaded into PaleoScan. It is now possible to integrate onshore topography and offshore bathymetry with the subsurface in PaleoScan.
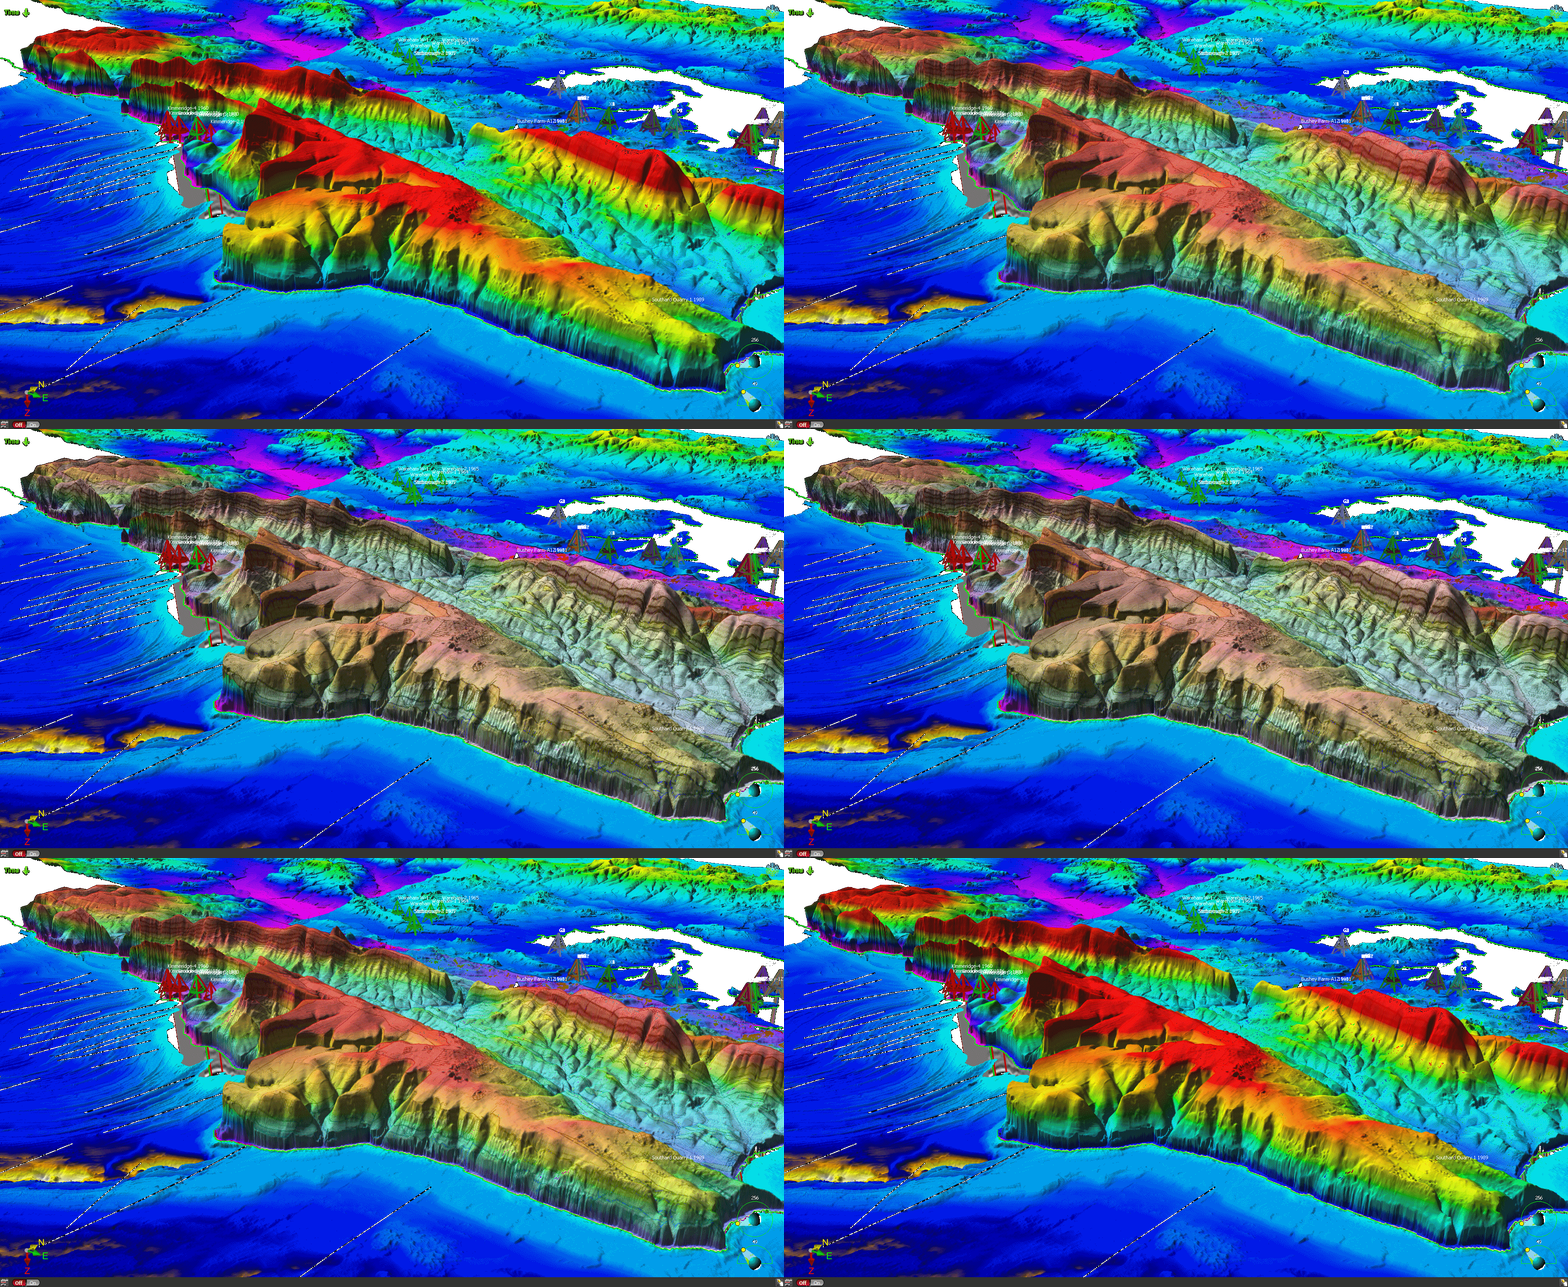
Fig 6 This is the same Dorset dataset (actually the Isle of Purbeck) viewed in 3D from the SE - but with a BGS surface geology map draped over the high resolution topography. It is now possible to drape geotiffs over 3D horizons in the 3D viewer in PaleoScan 2026.2.0 WOW!
If you currently don't use PaleoScan, or do use it but maybe don't get the full benefit of it as illustrated above, I would like to invite you to send me a SEGY file of one of your 3D surveys and allow me to show you what is possible in a very short time (happy to sign an NDA).
If you are interested, please contact me:
I am confident that I can complement the work done by your own interpreters, by for example:
-
Conducting a fast-track interpretation of a new 3D seismic dataset.
-
Providing a fast second opinion on an important interpretation e.g. a new planned exploration or infill development well location.
-
Interpreting a partner operated 3D seismic survey, which you may not have the time or resources to interpret in house yourselves.
-
Breathing life into an old 3D seismic survey and getting much more value from it by applying the very latest 3D interpretation functionality available in PaleoScan.
-
Conducting a fast-track 3D seismic interpretation ‘mid-processing’ – one of the best way to provide processing QC.
-
Coaching/mentoring your own staff to do all this themselves with confidence.
PALEOSCAN
Having been a power user of GeoProbe and Petrel over the past many years, I have now adopted PaleoScan as my preferred software application for 3D seismic interpretation.
-
PaleoScan is extremely powerful ‘next generation’ 3D seismic interpretation software, built and supported by a small French company called Eliis based near Montpellier in the South of France.
-
PaleoScan’s powerful functionality allows the very fast interpretation of every mappable horizon in a 3D survey. The resulting horizons can then be coloured by TWT/depth with contours, amplitude (or any attribute) with TWT/depth contours and with RGB blend/spectral decomposition data which can reveal depositional geometries with stunning clarity.
-
The mostly automated interpretation process allows input by the interpreter at key stages in order to create a robust and horizon consistent interpretation. Instead of autotracking horizons one by one - it effectively autotracks all horizons at the same time. The whole interpretation process takes just a few days, the actual time obviously being dependent on data quality and the size of the 3D survey. I continue to be surprised by how well PaleoScan performs in poor quality areas.
-
PaleoScan does not use AI for horizon interpretation – it uses very clever algorithms
and HI (Human Intelligence).
-
PaleoScan also includes a wealth of other interpretation functionality, for example a very useful data manipulation tool which allows one to change the orientation of a 3D seismic survey in a matter of minutes, for example to be orthogonal to a dominant fault trend. How often have you wanted to do that?
-
PaleoScan has a 3D viewer which is very good for reviewing the final interpretation products, particularly horizons coloured by spectral decomposition RGB data. A complete interpretation from surface to acoustic basement can be reviewed real time by simply rolling the mouse wheel – which I still find breathtaking.
-
The animation above further illustrates the interpretation power of PaleoScan, but one really has to use the software live with two wide screens in order to appreciate its true business value.
-
The 3D seismic data shown above is from the 3D survey acquired over the Maui gas field in New Zealand in 1991, shown courtesy of the New Zealand Government.
David M Roberts